Overview
Since its launch in June 2020, the data available on UNHCR’s Refugee Data Finder site has been explored by users several million times. The site serves comprehensive, reliable and up-to-date data - spanning over 70 years - on the world’s forcibly displaced and stateless populations. It provides a wealth of information for people working in the humanitarian and development sectors as well as researchers, journalists, and many other users. When using any data, understanding its provenance and how it has been produced is essential. Data on forcibly displaced and stateless people is collected in some of the most challenging circumstances, therefore it is critical to review the accompanying metadata to avoid inadvertent mistakes when analyzing and interpreting the data.
Here are five common mistakes when using the statistics in the Refugee Data Finder, along with an explanation of how to mitigate or avoid them.
1. Don’t confuse stocks and flows
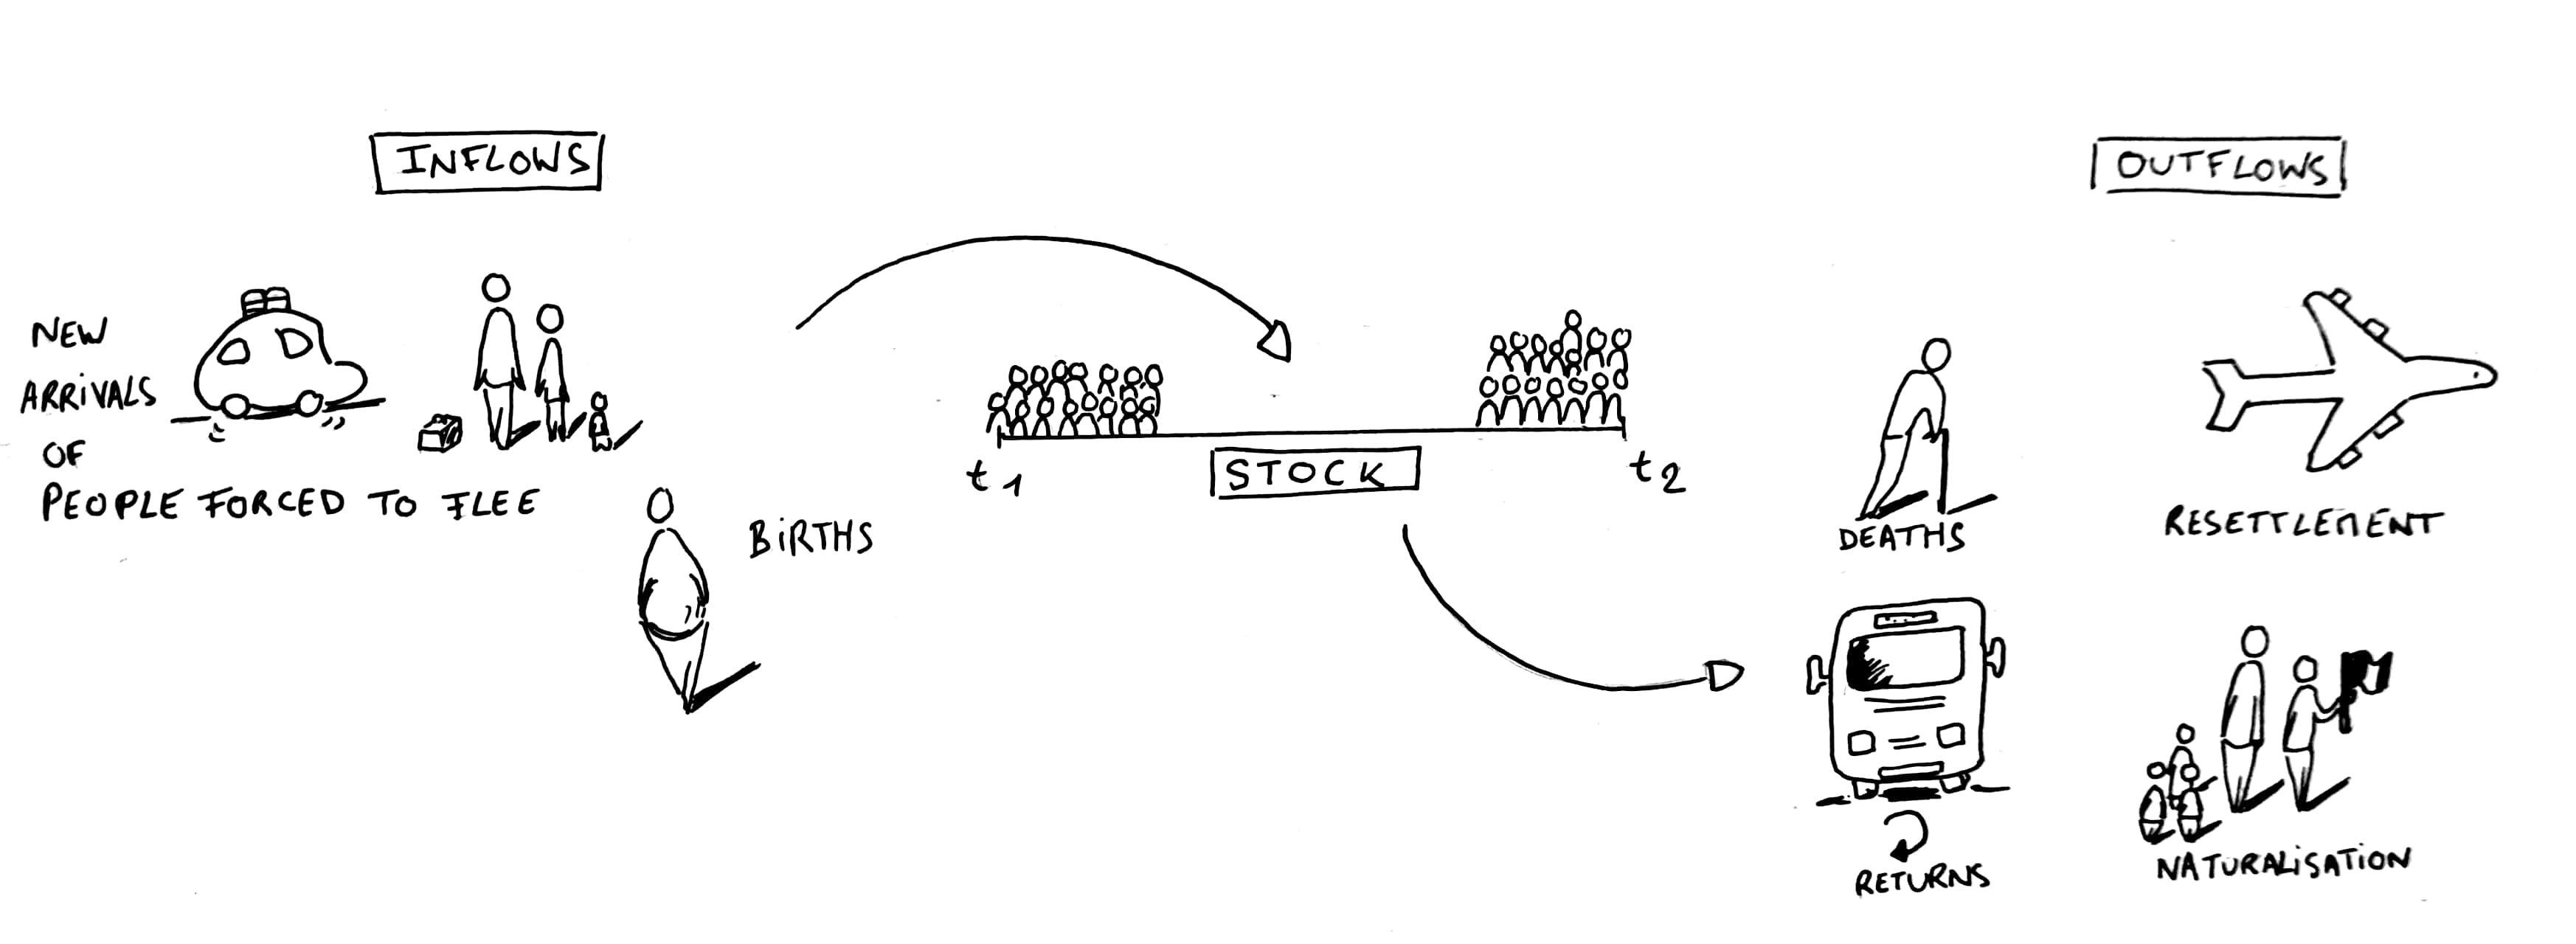
The Refugee Data Finder contains both stock and flow data. Stock figures record the number of people at a particular point in time, typically the middle or end of the year. For example, the number of refugees published in the site relate to those that were refugees at the end of each year.
Figure 1 | Stocks and flows in population statistics
Flow figures measure the number of people during a period of time, and in the statistics on the Refugee Data Finder the time period is typically six months or a full year. Examples of flow figures are the number of asylum applications and decisions as well refugees and internally displaced people that have found a durable solution. Here is a summary of the datasets in the Refugee Data Finder that are stocks or flows:
-
Stocks
-
Population figures
(including refugees, asylum-seekers, internally displaced people, other people in need of international protection, stateless people, others of concern to UNHCR and host communities
-
Internally displaced people
published by the Internal Displacement Monitoring centre
- Palestine refugees under UNRWA’s mandate
-
Flows
Using flow data to calculate stock data and vice versa is likely to lead to incorrect figures. Some examples of common mistakes and how to avoid them are given below.
Table 1 | Common mistakes in conflating stock and flow data
| Common Mistake |
Why is it wrong? |
How to avoid |
| 1. Assuming that the number of new individual asylum applications is the total number of people forced to flee across an international border during a period of time. |
Refugee status can be determined in either individual or group procedures. When refugee protection is determined in group procedures, it is normally provided when the claim is registered. Therefore, those receiving protection in this manner are not counted within the number of new individual applications.
In addition to group and individual refugee protection, in some circumstances individuals that would otherwise apply for refugee status instead apply for, and are granted, temporary protection. Temporary protection is considered to be complementary to the international refugee protection regime. It can be an effective tool to use in the context of large-scale displacement to provide immediate protection from refoulement, access to legal status and rights in host countries.
|
Use the
forced displacement flow dataset
which includes new asylum applications, group recognitions, temporary protection and new arrivals of people in refugee-like situations.
|
| 2. Estimating how many people have been forced to flee across an international border by adding new refugee recognitions (positive asylum decisions) and new asylum applications during that period. |
There are two primary issues:
- Asylum-seekers may apply and receive the decision on their application during the same reporting period and would therefore be counted twice.
- In other situations, decisions may relate to individuals who were displaced in earlier years – i.e. the decision would not be reflective of displacement during the reporting period.
|
For the same reasons as in the first example, use the
forced displacement flow dataset
.
|
| 3. Calculating the total pending asylum applications by adding asylum applications to stock figures from the previous period and deducting asylum decisions. |
Of note:
- In some cases, data on asylum applications and/or decisions is only partially available, so only stock figures are provided (mostly by governments).
- This also does not account for statistical adjustments due to changes in methodology.
|
Use the stock figures on
asylum-seekers with pending cases
provided on the Refugee Data Finder.
|
| 4. Estimating the total number of refugees by adding the number of refugees recognized (positive asylum decisions) during a given period to the total figure in the previous period and deducting those that returned or naturalized. |
The reasons include:
- Does not include other relevant flow figures including new births, deaths, resettlement departures, group recognitions or temporary protection, etc.
- Does not account for statistical adjustments due to changes in methodology.
|
Use
refugee stock figures
as provided on the Refugee Data Finder.
|
2. Don‘t confuse or conflate population categories
The statistics published on the Refugee Data Finder includes the following population groups (see the
who is included in UNHCR's statistics
for definitions of each):
- Refugees
- Asylum-seekers
- Other people in need of international protection
- Internally displaced people (IDPs)
- Stateless people
- Refugee returnees
- IDP returnees
- Others of concern to UNHCR
- Host communities
These population groups are often combined into broader categories, such as forcibly displaced people or people that UNHCR protects and/or assists. When referring to these broader categories, it is essential to understand clearly which populations are included in each, and which data sources are used to calculate them, to avoid misinterpretation or false conclusions.
Table 2 | Population groups by category
| Population type |
Forcibly displaced |
Population that UNHCR protects and/or assists |
| Refugees |
✔ |
✔ |
| Asylum-seekers | ✔ | ✔ |
| Other people in need of international protection |
✔ |
✔ |
| Palestinian refugees under UNRWA's mandate |
✔ |
- |
| Internally displaced people: |
|
|
|
•
Protected and/or assisted by UNHCR
|
-
|
✔
|
|
•
Reported by the Internal Displacement Monitoring Centre
|
✔ |
- |
| Stateless people |
- |
✔ |
| Refugee returnees |
- |
✔ |
| IDP returnees |
- |
✔ |
| Others of concern to UNHCR |
- |
✔ |
| Host community |
- |
- |
3. Don’t assume that all statistics have the same unit of measurement
Another common mistake is to assume that all the statistics have the same unit of measurement.
For statistics on forced displacement, this is most relevant for asylum applications and decisions.
The
International Recommendations on Refugee Statistics
promote reporting asylum applications and decisions per person and almost all countries now report these statistics at individual level.
However, some countries still provide data per case, i.e. for one or more people.
When per-case data is reported, a footnote indicates the average number of people per case, which can be used to estimate the number of people. Therefore, when using data on asylum applications and decisions, note the unit of measurement indicated in the “Cases (C)/Persons (P)” column and explore the relevant footnotes.
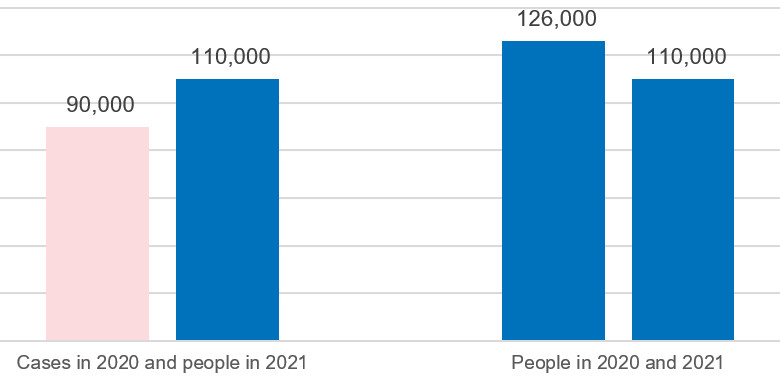
Some countries report using different units of measurement for different stages of asylum procedures, while for others, reporting by cases or persons has varied between years. For example, in the figure below, the data in 2020 has been reported per case, while data for 2021 has been reported per person. While it appears as though the number of applications has increased between years, when the average case size is applied to the 2020 data (in this example, the average number of people per case is 1.4), a decrease is observed.
Figure 2 | Example of the impact of applying the average case size to the number of asylum applications
UNHCR only recommends applying the average case size by country of asylum, as in the example above. The case size can vary considerably by country of origin, and therefore applying the average case size for specific countries of origin could be misleading.
For more information on the content and structure of the asylum applications and decisions datasets, see the
data structure section of the methodology page.
4. Don’t count displaced stateless populations twice
About 30 per cent of the reported number of stateless people worldwide are also displaced. Most of them are Rohingya, either internally displaced in Myanmar or refugees, mostly in neighbouring countries.
Figure 3 | Displaced stateless people
Since 2017, UNHCR has reported stateless people who are also displaced within its statelessness statistics. This means that these populations are included as both stateless and within one of the population groups for forced displacement (refugees, asylum-seekers, other people in need of international protection or internally displaced).
When combining statistics on stateless people with forced displacement population groups there is therefore a risk of counting the same people twice. In 2022, around 1.3 million people were both stateless and forcibly displaced.
To make the stateless status more accessible in the Refugee Data Finder, an additional filter is being incorporated into the demographic data and will be available for users soon.
5. Don’t ignore obvious errors!
UNHCR is committed to the continuous improvement of the quality of the statistics published on the Refugee Data Finder.
The production of UNHCR’s official statistics is guided by its Statistical Quality Assurance Framework which will be published in 2024.
The framework formally establishes and enables UNHCR’s commitment to quality official statistical outputs by defining the principles for statistical quality,
providing a set of quality objectives for each principle, and identifying the actions that are necessary to meet those quality objectives.
The Refugee Data Finder has also been designed with ease-of-use in mind. The site enables data to be selected, filtered and
visualized in charts and maps. Statistics can also be exported for further analysis and advanced users can leverage the
API
to use the data dynamically (see more on
how to use the API).
In case you observe a possible issue, have an idea for how the statistics or the site can be improved, or can’t find the specific
statistics you’re looking for, please do let us know using the feedback link at the bottom of the
home page. We will reply!


